Infinite Loop Detection in Agentic Orchestration Pipelines
Production traces reveal infinite loops in agent pipelines before users notice.
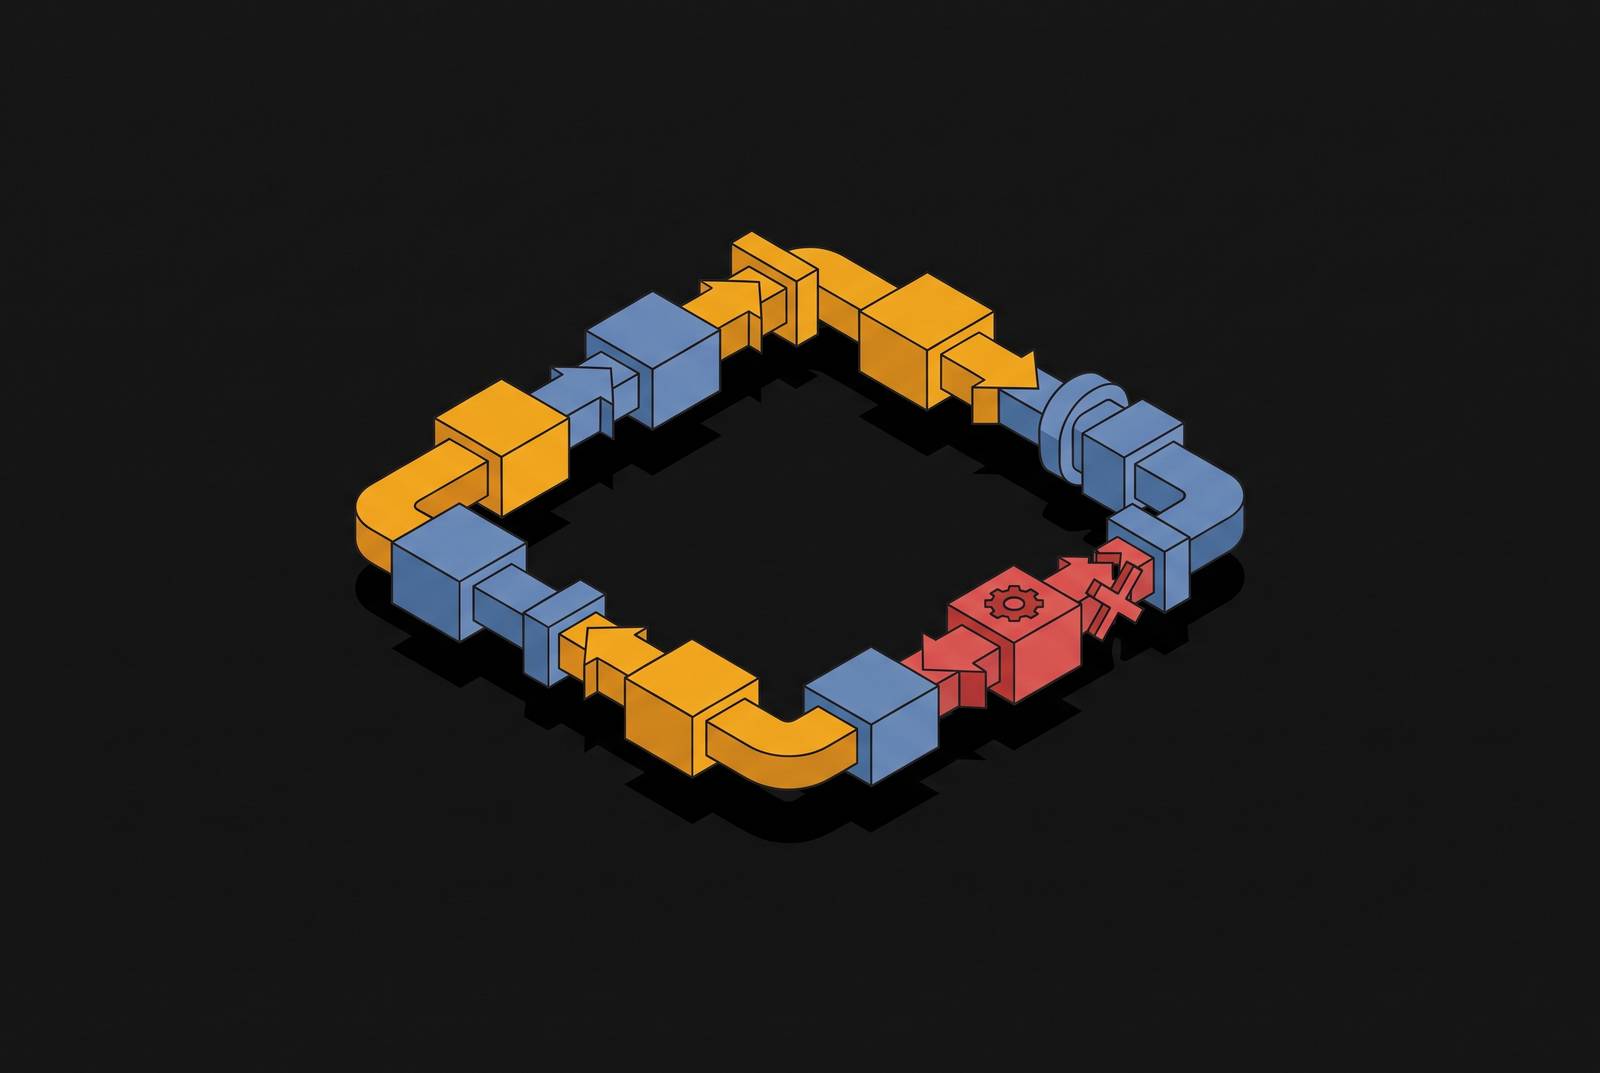
Infinite loops in agentic pipelines are structural failures in the harness that runs the model, not defects in the model itself. The standard agentic loop, reason, act, observe, decide, is built to repeat. The paper "When Agents Do Not Stop: Uncovering Infinite Agentic Loops in LLM Agents" defines this failure precisely: an Infinite Agentic Loop (IAL) is an execution failure in which an agentic feedback path repeatedly triggers LLM calls, tool invocations, agent executions, or workflow transitions without an effective termination condition, and the paper is careful to distinguish this from an ordinary programming loop. An IAL fails because of the interaction between agent logic, framework semantics, runtime observations, and termination mechanisms, four concerns that sit entirely in the harness and have nothing to do with the foundation model underneath.
The model appears to be the one deciding to keep going. The defect is not in that reasoning. Once the model is treated as effectively frozen in this analysis, the only place left to look is the pipeline around it, and the only way to look there with any rigor is to read what the production traces actually show.
The four feedback paths that produce unbounded loops
IALs are four distinct feedback path types, each one traceable to a specific component of the harness. The IAL-Scan paper catalogs the underlying repeated-path constructs as explicit loops, recursive calls, workflow cycles, retry or repair logic, tool reentry, and multi-agent delegation, and every one of these is a harness construct.
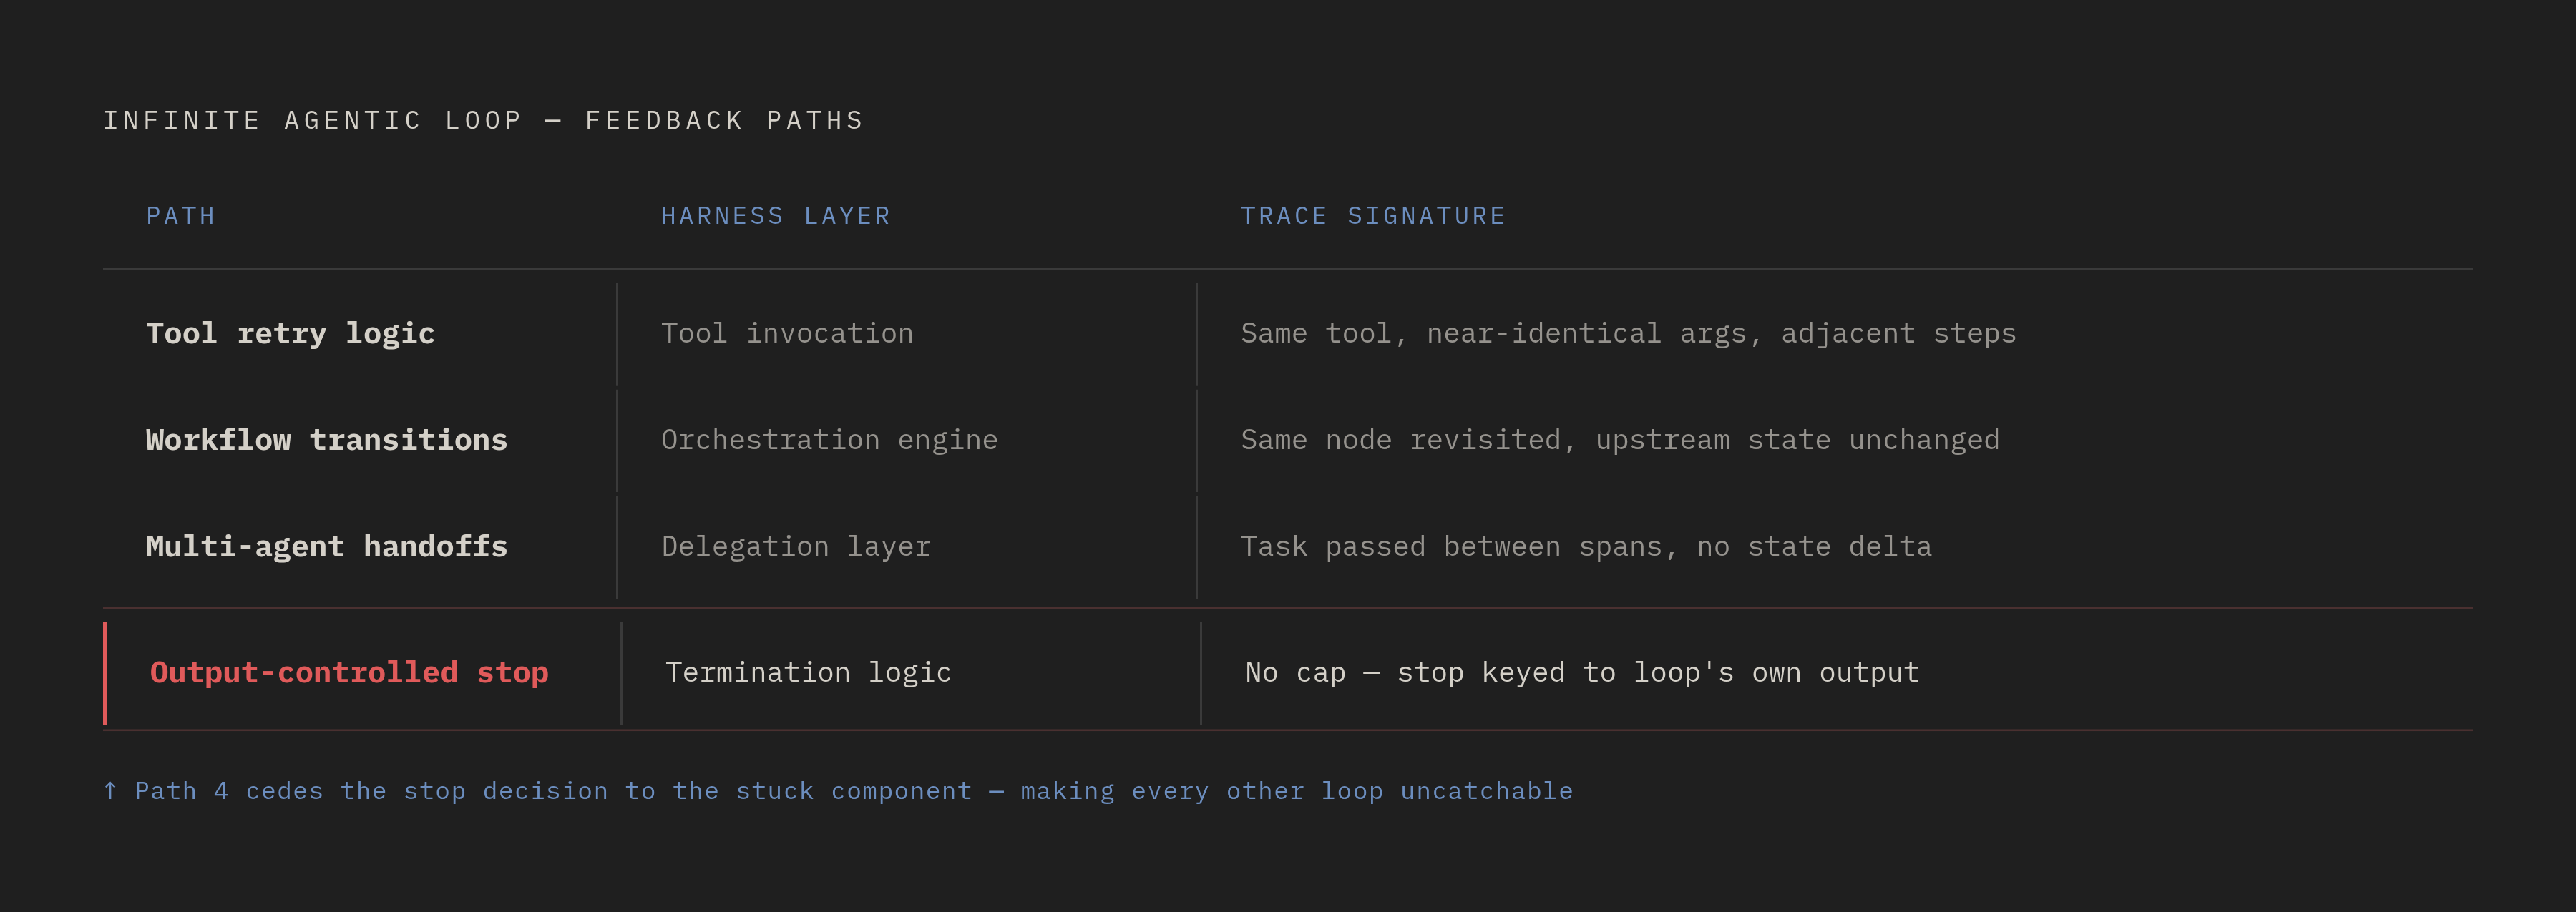
The first path runs through tool retry logic. A tool call returns a recoverable error, the planner reads that error as an incomplete state rather than a terminal failure, and the same tool gets called again with the same arguments. Nothing in the harness caps the number of identical calls, so the retry just continues indefinitely.
The second path runs through workflow transitions. The workflow cycles on stale state.
The third path runs through multi-agent handoffs, and it is the one that crosses architectural boundaries in a way the other two do not. The orchestrator re-dispatches without modifying the state that caused the failure. This is the hardest of the four to catch, because standard APM tooling observes each agent's span in isolation and has no built-in way to recognize that span A, span B, and span A again form a single repeating cycle.
The fourth path is less a mechanism than a structural weakness: continuation controlled by the model's own output. When the harness treats the model's generated text, a tool observation, an external state check, or a delegation decision as the thing that decides whether to continue, it has ceded the stop decision to the very component that is caught in the loop. A termination condition built this way is semantically fragile by construction, because it depends on the loop recognizing its own failure to make progress, which is precisely what a stalled agent cannot do.
| Feedback path | Harness layer responsible | What the trace shows | |---|---|---| | Tool retry logic | Tool invocation layer | Same tool name, same or near-identical arguments, repeated across adjacent steps | | Workflow transitions | Orchestration/workflow engine | Repeated visits to the same node with unchanged upstream state | | Multi-agent handoffs | Orchestrator/delegation layer | Task passed between two or more agent spans with no state modification between passes | | Model-output-controlled continuation | Termination logic | No structural cap; continuation decision keyed to output the loop itself produced |
What production traces show when a loop is running
A loop that is actively running leaves a visible signature in production traces before it surfaces as a user-facing incident, and reading that signature correctly is the first real diagnostic step. A trace captures one complete run as a tree of spans: the top-level request, each planning step, every model call with its full prompt and completion, and every tool invocation with its arguments and result. A trace read from top to bottom is a replay of how the agent reasoned and acted, step by step.
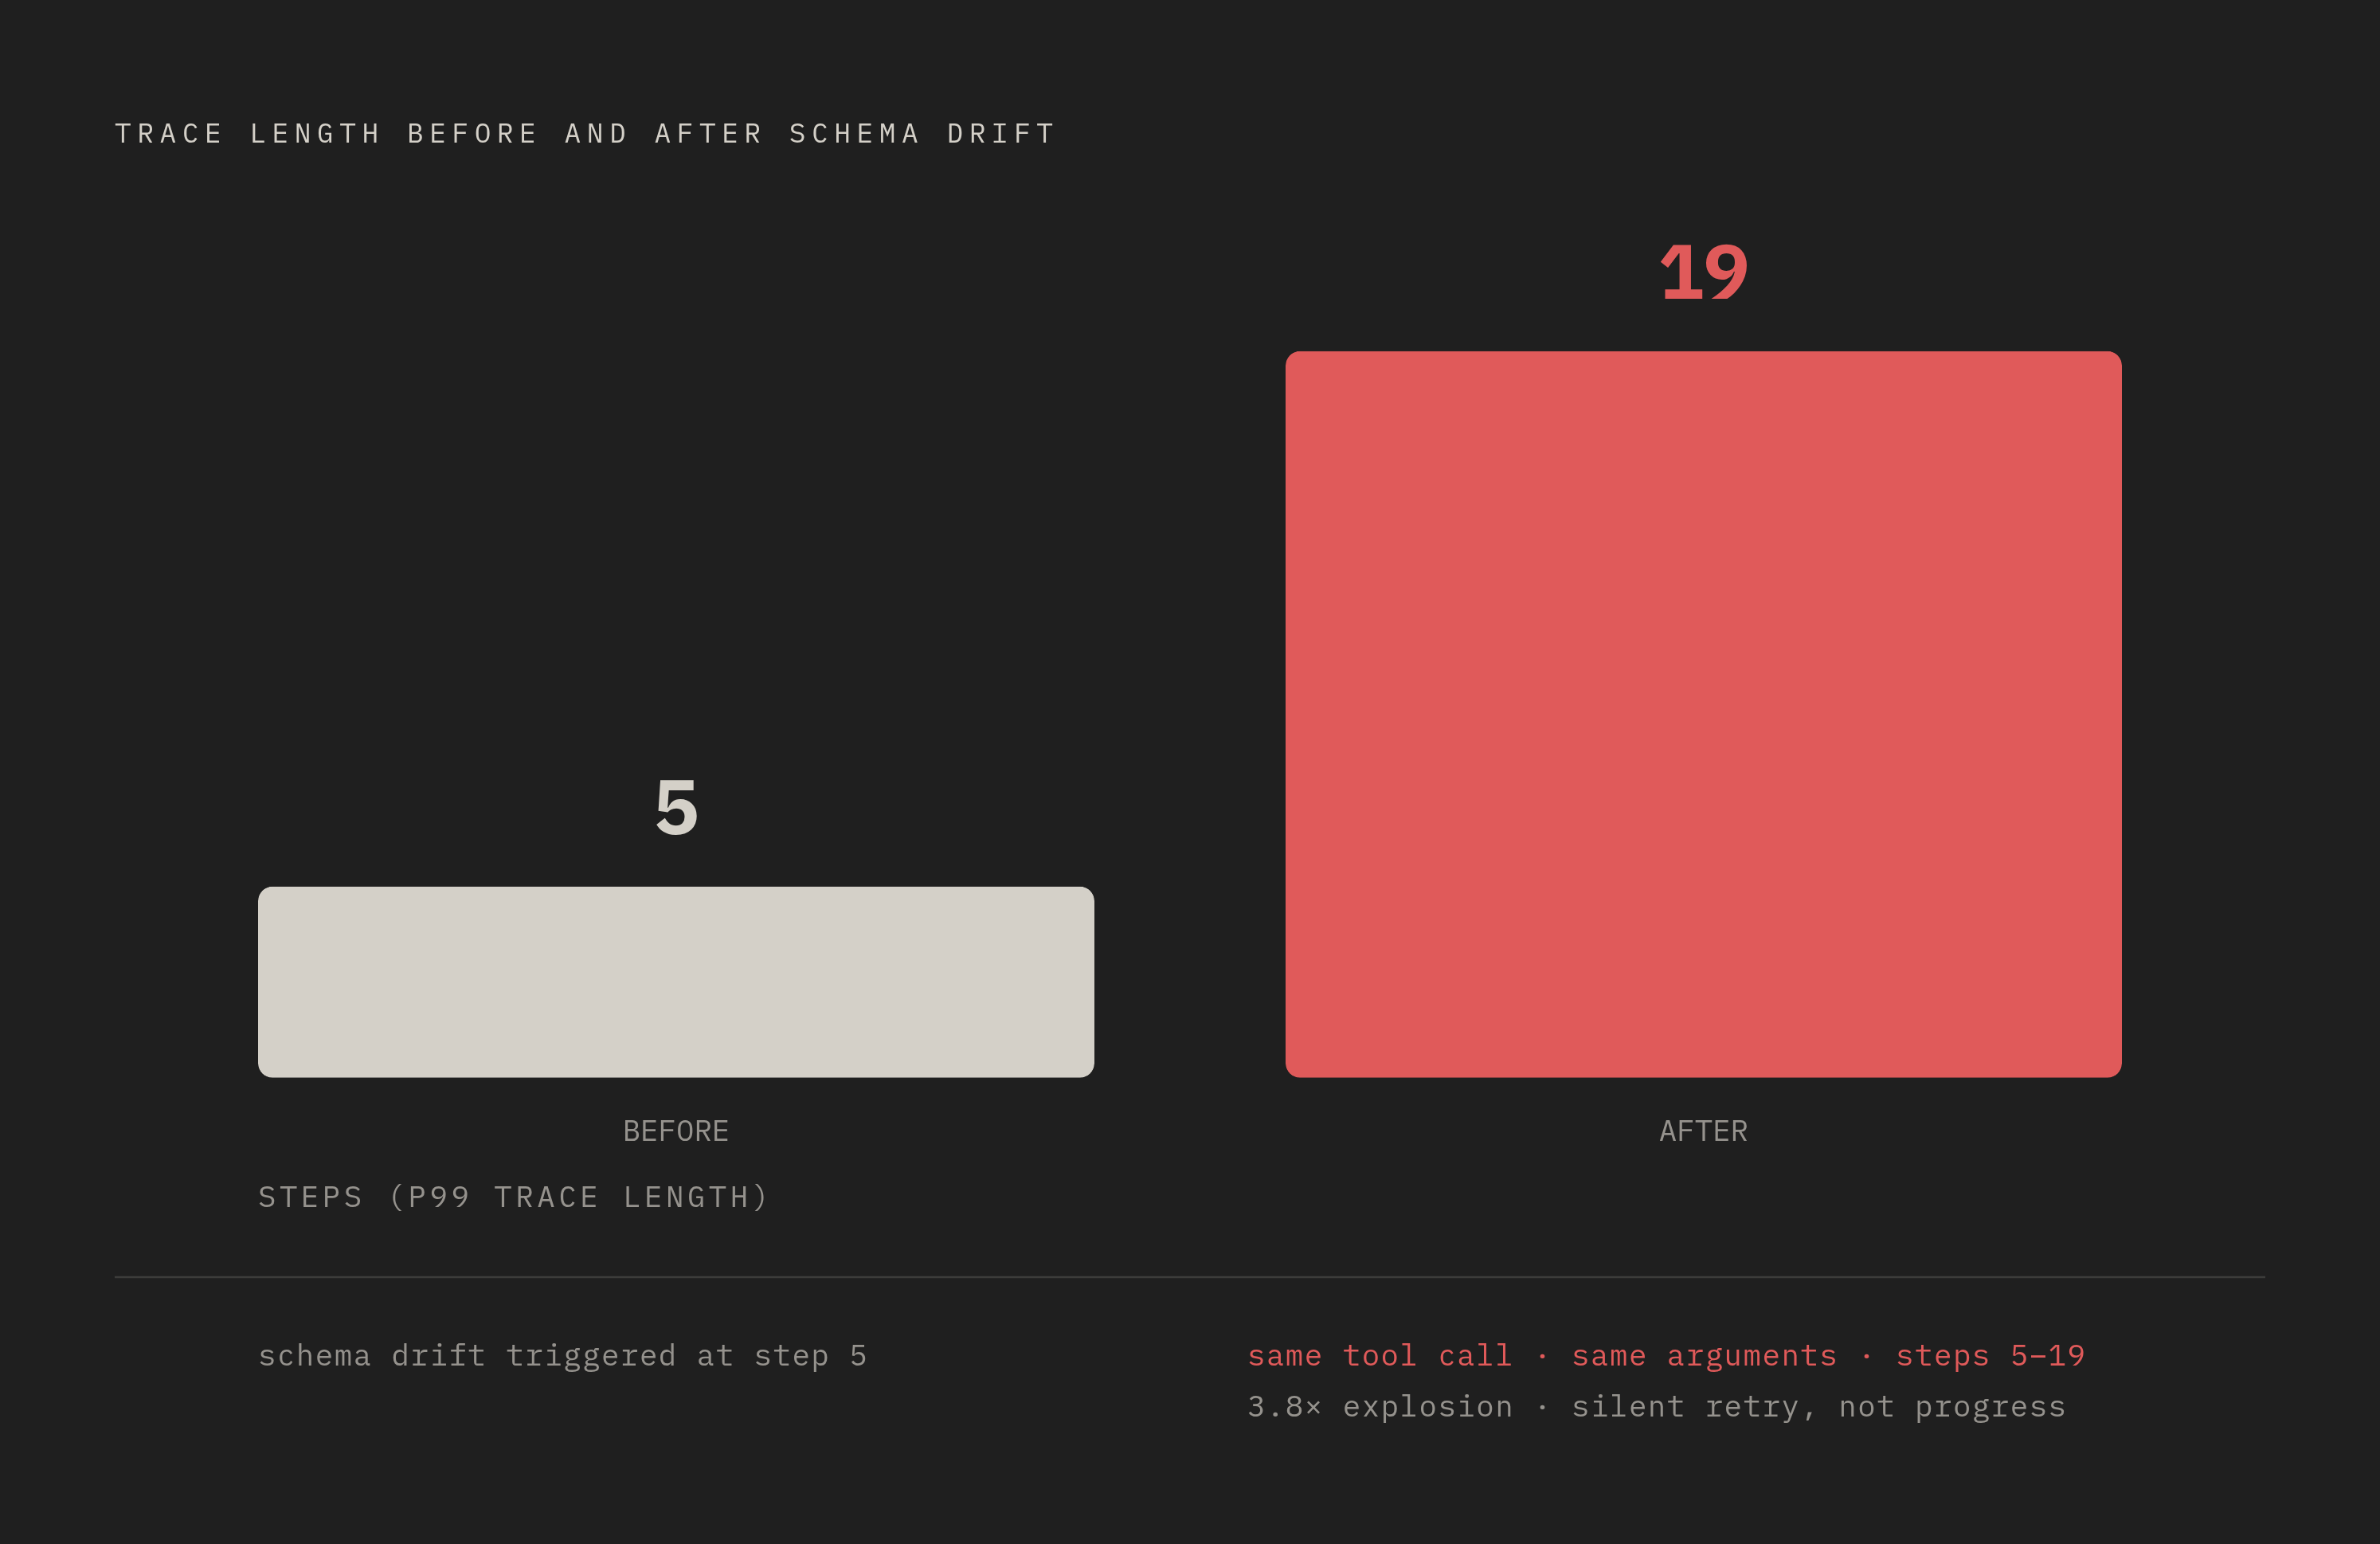
A loop in progress produces duplicated trajectory-step spans: the same tool name and nearly identical arguments recur across adjacent steps, the planner's stated rationale repeats nearly word for word, and the same piece of missing state reappears call after call. Nothing in the agent's observable environment has changed to tell it otherwise, so it just keeps replaying the same decision. In a documented production case, a support agent using an order-status tool began timing out after the tool's schema changed underneath it, and trace data showed p99 trace length rising from 5 steps to 19 steps, with the repeated spans all carrying the same tool name and nearly identical arguments.
Three metrics deserve the earliest alerting priority: cost per run, steps per run, and task success rate. A drop in task success rate catches a different and equally important class of problem, correctness regressions that never throw an HTTP error at all because the pipeline completes and returns an answer, just the wrong one. Tool-call success rate belongs alongside these three as a near-term addition, because a quiet decline in how often tool calls return usable results is often the earliest trace of the schema drift or state corruption that triggers a retry loop.
The most common misread of this data happens at the latency layer. If a long-running task is making genuine progress, it keeps adding something at each step. An infinite loop repeats the same action pattern with nothing new to show for it, and that distinction only resolves at the level of individual spans, never at the level of the overall request. Compounding the diagnostic difficulty, loops frequently hide behind a "still thinking" UI state that gives users no indication anything has gone wrong, which makes user-facing signals a lagging indicator at best. Traces are the leading indicator, and they are the only place where the failure is visible while it is still cheap to stop.
How IAL-Scan's static analysis catches unbounded paths before deployment
Some unbounded feedback paths can be found before an agent ever executes a single request, through static analysis built specifically to reason about agent execution semantics. General-purpose static analysis tools such as CodeQL and Semgrep find many source-level vulnerability patterns, but they do not model the constructs specific to agent frameworks, including framework API edges, tool dispatch, handoffs, and agent reentry. A loop hidden inside a framework's own orchestration logic is invisible to them by design.
IAL-Scan addresses this gap by abstracting the agent's source code into a framework-independent intermediate representation, called Agent IR, and then building what the paper calls an Agentic Loop Dependence Graph, or ALDG, to recover both the explicit loops written directly into the code and the loops induced indirectly through framework behavior. Once that graph exists, the tool checks whether any path through it can repeatedly reach a costly or state-growing operation, a model call, a tool invocation, a workflow transition, without passing through any effective bound.
Three challenges shape how this analysis has to work. And the analysis has to confirm that a bound actually covers the specific feedback path in question, not just that some iteration limit or exit condition exists somewhere in the codebase without ever touching the path that loops.
Run across thousands of LLM agent repositories, IAL-Scan produced 74 potential findings, of which 68 were confirmed as real IAL failures, spanning dozens of distinct projects, at a precision of 91.9%. That rate of confirmation says these failures are not edge cases turned up by an overly aggressive scanner. What static analysis cannot reach, though, is the fourth feedback path described earlier: termination conditions that are semantically fragile because they depend on model output, tool observations, or external state evaluated at runtime. No amount of code inspection resolves whether a given observation will, in practice, look incomplete to the model on the tenth call the way it did on the first. That question can only be answered by watching the system run.
Runtime detection: scoring trajectories to locate where progress stopped
Knowing that a loop occurred somewhere in a trace is a weaker result than knowing exactly where in the trajectory progress stopped, and the second question is the one that actually points an engineer at the responsible layer of the harness. Response-level evaluation checks only the final output of a run, so it misses this entirely, because the damage in a loop accumulates across repeated planner and tool spans long before any final response gets generated. Alerting on a timeout at the end of a run catches the failure many steps after it actually started.
Step-level scoring closes that gap. A second signal is the iteration-count p99, but it has to be set per release rather than as one global threshold, because step counts that are normal for one workflow are symptomatic for another: a twelve-step workflow can be entirely legitimate, while a four-step workflow that should resolve in two is already showing early loop behavior. A third signal is token cost per trace, which catches the subset of loops that still terminate in an answer that looks acceptable on its face but got there by burning far more computation than the task warranted.
Three mistakes routinely blunt this kind of detection. And when the final answer gets treated as the incident, rather than the step where progress actually stalled, the engineer's attention lands many steps downstream of where the fix needs to happen. If you group traces by session and compare adjacent steps for repeated tool names, repeated arguments, repeated planner rationale, and the same persistent gap in state, you turn a raw trace into a specific loop candidate ready for targeted review.
Tool schema drift as the most common silent loop trigger
Tool schema drift is the single most common root cause behind silent loops, because it produces a failure that looks plausible at every individual step. The harness is built and tested against one version of a tool's input and output schema. The tool is updated independently, often by a separate team or a third-party API maintainer, and tool calls begin silently failing or returning malformed data that no longer matches what the harness expects. The planner, seeing a result it cannot parse into something complete, interprets that failure as incomplete state rather than a structural mismatch, and retries, producing exactly the cycle described in the support-agent example where p99 trace length climbed from 5 steps to 19.
Several signals in trace data reveal this kind of drift before it becomes a full incident: the frequency of unknown fields appearing in tool payloads, the rate of attempts that are missing a required field, how often the system falls back to default values after a tool invocation, and any mismatch between the schema version the planner was built against and the schema version the runtime is actually serving. Schema drift rarely produces a dramatic, instantly visible outage. It produces a believable-looking answer sitting on top of a broken call, so it can persist across several releases before trace analysis finally surfaces it.
Prompt ambiguity and missing termination conditions as the second loop source
A prompt that never defines a verifiable done-condition leaves the agent with no internal signal that the goal has been met, so the loop continues even after the task is, by any outside measure, already complete. A goal that is fuzzy at the outset never has a clean stopping point, and that absence pushes the termination decision back onto the model's own output, which is the same semantically fragile mechanism described earlier. A model given no concrete definition of "done" is behaving reasonably when it keeps generating further steps, because nothing in its environment has told it to stop.
This failure takes a distinctive shape in multi-agent systems: two agents can loop against each other indefinitely because neither one holds a termination condition that the other's output actually satisfies. Memory context rot adds a second layer of difficulty on top of this. As summarization cycles accumulate across a long-running session, the agent's own internal representation of its original goal degrades, so even a termination condition that was perfectly clear at the start becomes harder and harder to evaluate as the session continues.
Tool schema drift and prompt ambiguity sit at adjacent layers of the harness, the tool-invocation layer and the termination-logic layer, and in practice they often occur together in the same incident. Fixing either one requires a specific, layer-targeted intervention. Neither responds to a generic round of prompt tuning.
Fixing loops at the harness layer: per-layer interventions and their order
Each of the root causes identified above calls for a different intervention at a different layer of the harness, and if you fix the wrong layer, the underlying loop stays fully intact while the team gets false confidence that the problem has been addressed.
An iteration cap and a no-progress detector both need to exist as structural bounds that sit outside the model's control entirely, so that even a termination condition that turns out to be flawed still has a hard backstop.
Workflow transition cycles call for a state-change check inserted before the harness allows re-entry into a node the agent has already visited. If the condition that triggered the original transition has not changed, the transition should be blocked or escalated rather than replayed, because replaying it guarantees the same outcome that caused the cycle. Applied in that order, tool layer, termination layer, workflow layer, the fix follows the same path the trace itself revealed: the loop started somewhere specific, and the repair belongs exactly there.