How CrewAI Agent Tool Wrappers Bury Exceptions and What Instrumentation Catches Them
Instrumentation inside tool bodies captures exceptions before CrewAI's wrappers erase their type.
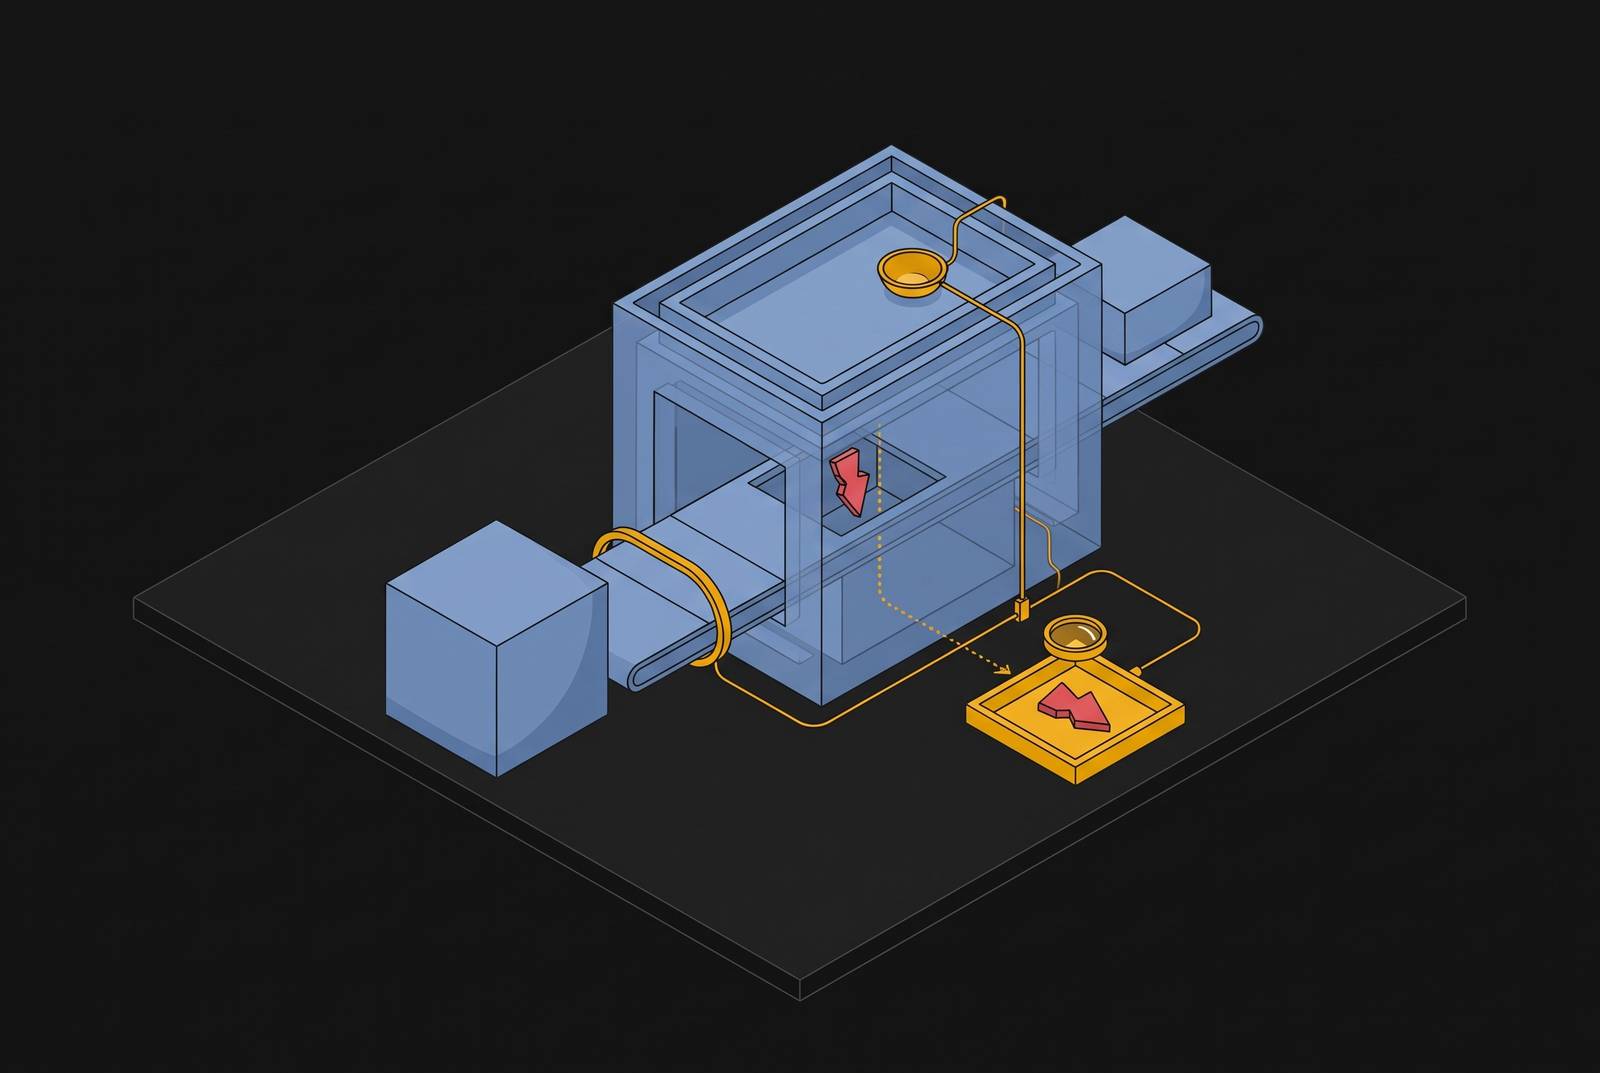
Silent tool failure detection in production multi-agent pipelines requires instrumentation inside the tool body, before CrewAI’s wrappers convert exceptions into error strings. Tool-call traces must keep exception identity and call context, because monitoring above that boundary sees only the flattened result. Those signals let engineers distinguish failures that warrant retries from failures that require execution to stop, then validate changes against production evidence.
How CrewAI's tool wrapper architecture converts typed exceptions into undifferentiated error strings
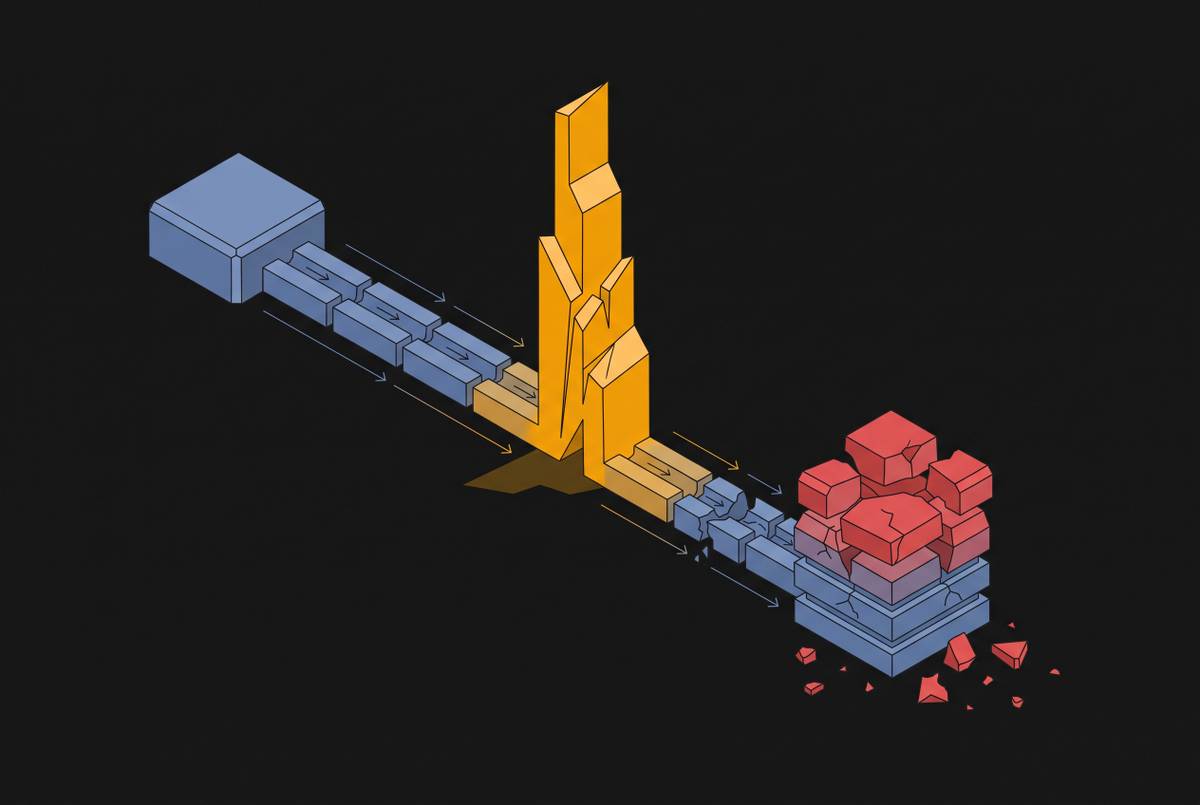
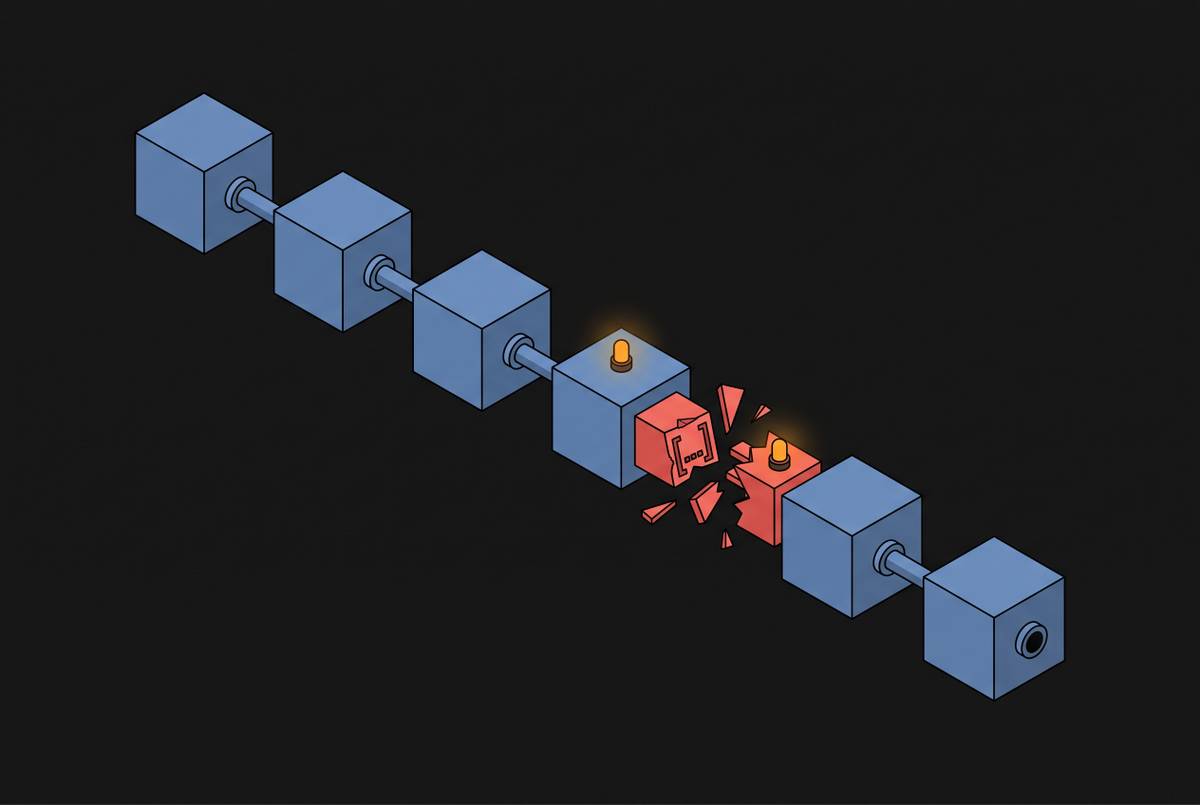
CrewAI’s tool execution pipeline catches exceptions in broad except Exception blocks and returns formatted strings such as "Error executing tool: …" instead of propagating typed exceptions to calling code. The conversion removes the exception’s identity and traceback. By the time the agent receives the result, a structured failure has become text. Upstream branching logic can no longer use the original exception class to decide what should happen next.
CrewAI repository PR #6265, dated June 2026, documents this behavior across crew_agent_executor.py, experimental/agent_executor.py, agent_utils.py, and llm.py. The PR describes exceptions as “caught and replaced with generic error strings like 'Error executing tool: {e}', discarding the original traceback and making debugging impossible”. Its fix appends traceback.format_exc(limit=5) to the returned string. That improves the diagnostic text available to a reader. It does not restore a typed failure object, so the return path still cannot provide callers with exception identity as structured data.
Why this matters more for some exception types than others — and what gets silently retried
The cost of this conversion depends on what the exception means. A transient network timeout may be recoverable through another attempt, while a billing refusal or an idempotency conflict requires a different response. Flattening puts these failures through the same return path. Their messages may differ, but upstream logic no longer has the typed signal needed to distinguish them reliably at runtime. PR #6265 describes the risks this creates, including double-charging a customer and hiding the real reason a call failed.
CrewAI’s default response to a tool error string is to add it to agent memory and re-enter the reasoning loop. max_retry_limit governs error retries, while max_iter caps the overall loop. Consequently, a terminal billing failure that should stop execution can instead be resubmitted as the agent continues attempting the task. The retry is no longer grounded in exception semantics. The framework has supplied feedback for reasoning, but the failure required a control signal.
Returned text can support recovery when the agent has enough information to choose a valid next action. The distinction is whether the failure permits another attempt. Where billing, permissions, or idempotency determine that answer, treating every failure as ordinary feedback removes a decision boundary that production code needs to preserve.
How the agent's reasoning loop amplifies silent failures into multi-step damage
Once the error string enters memory, the failure extends beyond the tool call that produced it. The agent sees a tool result and continues reasoning from that result, potentially choosing another tool, modifying its approach, or repeating an earlier action. Each choice becomes part of the workflow’s state from then on. A failure that was silent at the exception boundary can therefore corrupt multi-step context before the final output reveals a problem.
The feedback can also point recovery in the wrong direction. An error message mentioning “network timeout”, for example, can lead a retrieval-augmented agent toward semantically adjacent but operationally wrong tools. The words are relevant to the message but not necessarily to the task’s recovery requirements. Rather than resolving the first failure, the agent may build additional work on an interpretation that was wrong from the outset.
max_iter, which defaults to 20, sets a stopping point for the whole loop, while max_execution_time and allow_delegation=False add controls that must be set deliberately. Without step-level traces, the work between the initial failure and the stopping point remains difficult to reconstruct, even as error feedback accumulates in memory. A bounded loop can still produce a corrupted answer. Limiting its duration therefore does not replace observing the failure and the decisions that followed it.
How do you know which layer caused a silent tool failure?
At the point of observation, a generic error string establishes that a tool reported trouble, but it does not reliably attribute that trouble to its source. A billing refusal, a permission denial, and a network timeout need different responses. Once their exception identity is gone, they share the same untyped representation. Message text may offer clues, but clues are not a preserved failure contract. Diagnosis must recover context that the return path discarded.
Other silent failures complicate that diagnosis because they can produce a similar downstream symptom without raising an exception at all. In a typical schema-drift failure, the schema may validate while the LLM improvises around a broken response, leaving the defect to emerge later as corrupted output. Prompt ambiguity can likewise produce a plausible but wrong decision. Without a trace linking that decision to its input prompt, an instruction defect can look like a capability gap. The resulting intervention may be a model upgrade when the actual defect lies in the harness.
These cases require related but distinct evidence. Exception-flattening failures need the original type and call context, while schema drift and prompt ambiguity require records of inputs, outputs, and decisions. Token counts, latency, and error rates by agent role help measure runs as a group. They cannot identify which layer caused a particular failure. Recovering attribution therefore requires capturing structure before the wrapper erases it, and preserving enough surrounding context to recognize failures that never raised exceptions.
Where instrumentation must be placed to read exception identity before it is erased
Instrumentation belongs inside the tool function body, on the exception path before the wrapper’s broad handler converts the failure to a string. Placement is the decisive technical requirement here. Instrumentation placed only above that handler gets the result after it has been turned into a string, however fully it records the crew invocation. The four files named in PR #6265 show where these conversions take place.
PR #46 demonstrates the preservation principle in _run and _arun. Those methods re-raise InsufficientFundsError, PermitDeniedError, DeliveryUncertainError, and IdempotencyConflictError before the generic except Exception handler runs. This prevents domain-significant failures from being swallowed by that handler and lets callers distinguish them at that boundary. Re-raising at one layer does not make instrumentation above a later string-conversion point sufficient.
The decorator does not auto-wrap async exceptions, so placing a handler around crew execution is not a substitute for a try/except inside the async tool. That location gives instrumentation access to the exception while its identity is intact. It also ties the recorded failure to the tool invocation that actually raised it.
Individual tool-call spans make that evidence recoverable from a trace store. A span records the exception type, input arguments, and timestamp for the call, preserving the context needed for later analysis without executing it again. The useful unit is the call where the failure occurred, connected to the steps that preceded and followed it.
What production traces reveal that error strings cannot — and how that changes what gets fixed
Structured traces make recurring failures queryable across production runs. Across thousands of runs, the same tool failing at the same step with the same exception type becomes a specific pattern. That specificity changes the engineering target. Instead of treating each incorrect answer as a new model problem, a team can connect repeated failures to a particular tool path or harness decision. Unstructured log lines do not support aggregation at that level of precision.
Tool inputs and outputs can also show defects that exception capture alone misses. If a field changes from customer_id to account_id, the wrapper may raise no exception, even though the mismatch eventually corrupts the output. A trace recording every tool input and output can show the exact call where the mismatch first appeared. The first visible wrong answer is then no longer the only diagnostic anchor. Engineers can locate the earlier divergence before downstream reasoning obscures it.
Historical traces also provide evidence for evaluating a proposed correction. A stricter tool schema, tighter prompt, or re-raised typed exception can be tested against the captured failure through replay-based validation without rerunning the live workflow. This connects diagnosis to a reviewable change. It gives the team a basis for judging whether the intervention addresses the recorded failure rather than merely producing a plausible explanation for it.
The 2026 observability baseline described in the brief includes telemetry-native auto-instrumentation, span-attached evaluation scores, multi-agent trace propagation, and a single interface for trace, score, prompt, cost, and latency. Propagation links what agents do across the workflow, while scores link execution records to measures of quality. Viewing one trace can explain one run. To measure production quality, teams need to link those records across traffic so they can assess repeated failures, proposed changes, and validation results together.
Practical changes that recover typed failure signals in a CrewAI harness today
The practical response is to change failure handling at the tool boundary and collect the resulting signals as structured traces. Begin by replacing undifferentiated handling inside tool functions with explicit handlers for domain-significant exceptions, including billing errors, permission denials, and idempotency conflicts. Re-raise those exceptions or map them to ToolException before the generic handler runs. PR #46 supplies the typed re-raise pattern. These changes do not require a model change or a framework fork.
Use ToolException from crewai.tools, available in v0.30.0+, for failures that are meaningful to the agent’s decision logic. Reserve returned error strings for failures the agent can recover from without typed context. For async tools, put the try/except inside the async function body. Capture exception identity there before any later wrapper can flatten it. Raising a signal that the agent can act on and recording it must be kept as separate tasks.
Sanitize error strings at the point of construction. With verbose=True, agent interactions, including thoughts, tool invocations, and results, are logged by default, although tool-level error messages inside @tool functions are not automatically captured unless explicitly raised or logged. Sensitive details can thus reach logs in messages that tools return or record. Strip API keys, internal IPs, and database names before returning those strings. Cleaning them after logging is too late for that boundary.
Instrument individual tool-call spans with the tool name, input arguments, exception type, and step number so that failure patterns can be queried across runs. Set max_iter and max_execution_time deliberately when using fallback patterns, because retries can consume iterations quickly while adding poisoned context to memory. These controls bound continued execution, while tracing preserves evidence of what failed and how the workflow responded.
Finally, treat each change to the harness as a change to production code with its own version. A prompt revision, schema tightening, or new typed exception path belongs in review and should be validated against historical traces before deployment. That makes the process repeatable across different failure classes.