Tool Call Latency Spikes and Their Downstream Effect on Agent Quality
Slow tool calls trigger cascading reasoning failures that standard monitoring can't detect.
Tool-augmented LLM agents are not operationally equivalent to their API contracts, even when the interface looks identical. Latency, rate limits, failure modes, and answer quality all vary across providers and load conditions, and that variance feeds straight into the quality of the agent's reasoning. The common framing treats a latency spike as a user-experience problem: the response took longer, the dashboard shows a bump, move on. That framing stops too early. The agent's reasoning is damaged not by the wait itself but by what it does with everything that happened while it waited, and the Production Agentic Evaluation Framework gives this pattern a name: FM-6, the correlation between rising p95 tool latency and falling decision quality.
An agent can look busy and still be failing. It can call tools that match the task, produce reasoning steps that read coherently, and still never complete the job, or complete it only after burning through a token budget it didn't need to spend. Twelve API calls to answer a question that needed two doesn't just cost twelve times the latency of one call. It adds the latency, adds the token overhead of carrying twelve rounds of context, and adds the dollar cost of all of it at once, so the inefficiency stacks rather than simply accumulating. When a tool call slows down, you don't just get a longer wait: the agent reasons worse, and the rest of this piece traces how.
The causal chain from a slow tool call to a degraded decision
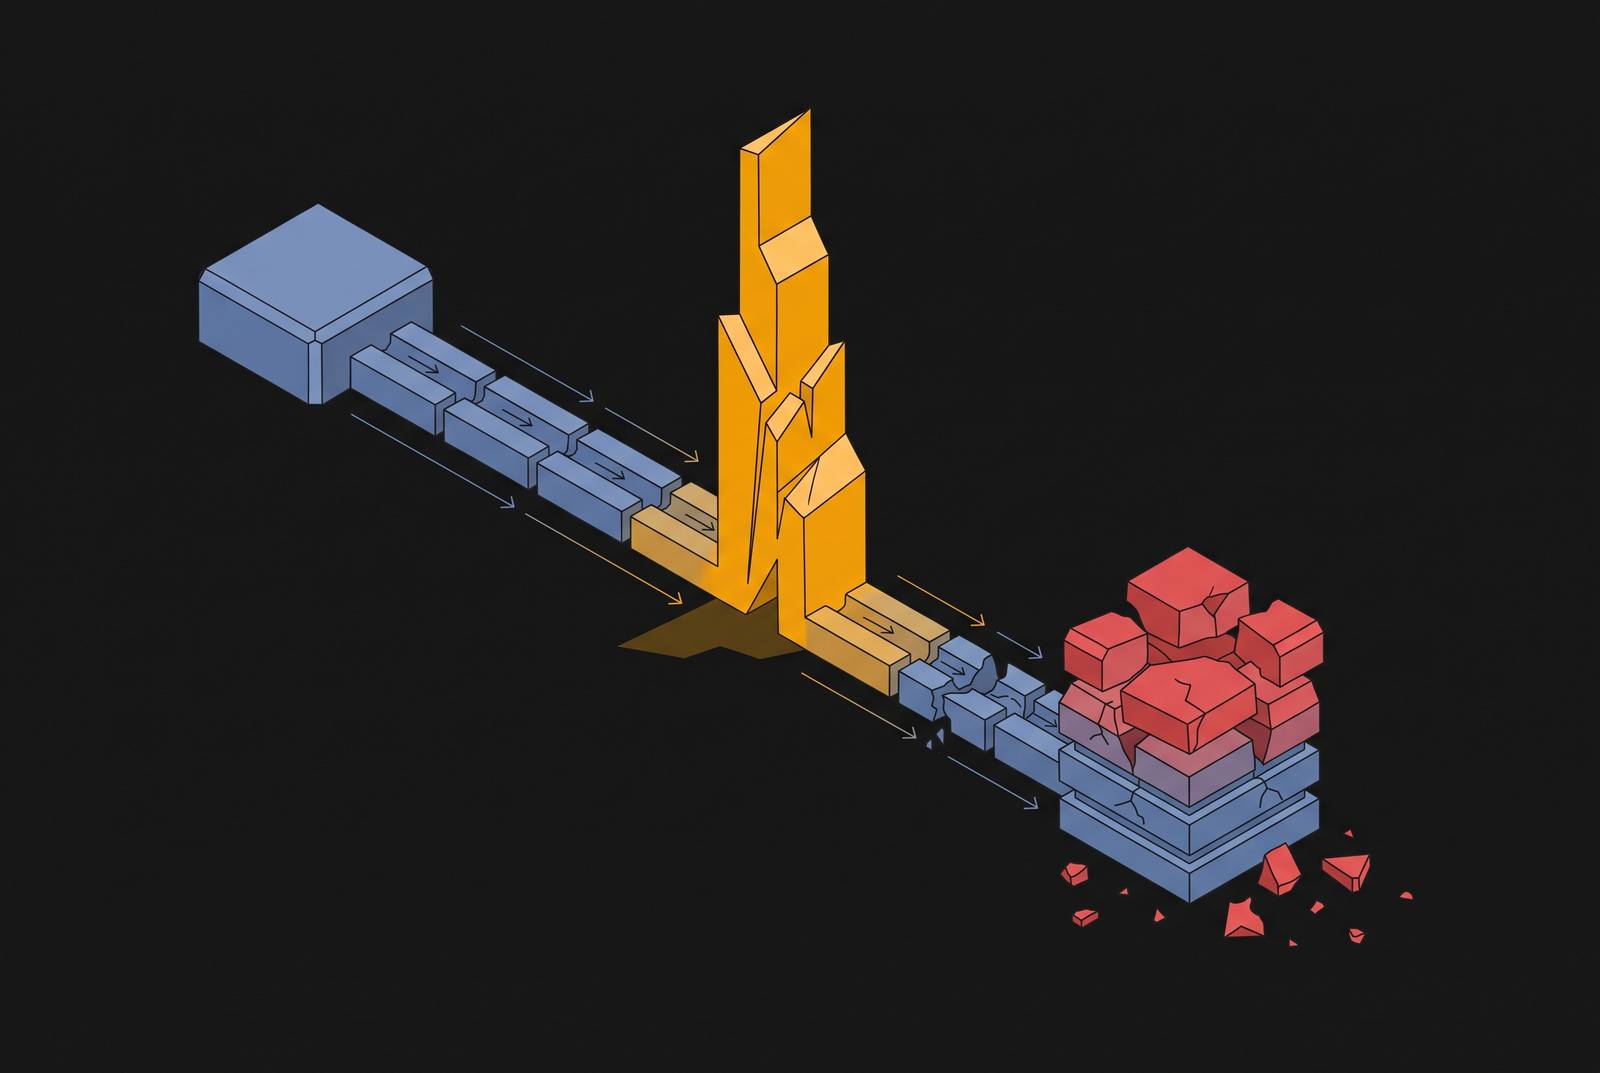
A single slow tool call starts a chain, and each link in that chain weakens the agent's reasoning on its own terms before compounding with the next.
First, the wait itself costs tokens. While the agent sits on a slow response, the context window keeps filling, and you pay a fixed token tax for tool definitions on every request, whether the agent calls them or not. Passing every available tool schema to the model on every iteration is a well-known failure mode: tool selection accuracy falls as the schema list grows. A 2026 study found that selective discovery, showing the model only the tools relevant to the current step rather than the full catalog, cuts tool-context exposure by about 4,013 tokens while still meeting a recall non-inferiority bar, and the model finds the right tool just as often with far less token overhead. Token costs climb with the size of the tool list regardless of how many of those tools actually matter to the task at hand. Large tool outputs make this worse: once the context window fills, the agent has two options, truncate the output and lose information, or reset the session and lose all prior context. Either way, the agent ends up reasoning from a weaker starting position than it had before the slow call returned.
Second, a slow or ambiguous tool response starves the agent of the signal it needs to move forward, and that starvation triggers loops. The clearest signature of a stuck agent is repetition: the same tool, called with the same arguments, for a third consecutive iteration. That pattern indicates the agent has lost its way rather than made genuine progress. Each loop adds more latency, burns more tokens, and grows the context further, so the squeeze tightens on every reasoning step still to come. Context overflow deepens the trap: long sessions fill the window and reasoning quality degrades gradually across the whole run rather than failing at one clean breaking point, so an agent stuck in a loop finds it progressively harder to escape the longer the loop continues.
Third, and least visible, the agent drifts off its actual goal. Goal drift sets in when the agent starts chasing something related to the task but not the task itself, usually because a tool result pulled it sideways, or because an ambiguous instruction got amplified by the bloated context the latency spike already left behind. Rising average token counts are a leading indicator of this kind of drift, since they signal prompt bloat or unnecessary context accumulating in the session, both of which widen the room for ambiguity across multi-step reasoning. The trouble is that this signal looks, on a dashboard, identical to healthy throughput growth. A team watching token counts climb has no easy way to tell whether the agent is doing more legitimate work or drifting further from the task with every step. That ambiguity is why conventional monitoring fails to catch it. The next problem begins there.
Error-rate alerts are blind to this class of failure
In a documented 2026 production case, an agent's routing accuracy dropped from 93% to 71% after a silent update to its underlying LLM provider. No test caught the regression. No alert fired. The drop surfaced only after a surge in customer complaints forced a manual investigation. Every infrastructure signal in that system read healthy throughout: no errors, normal latency, expected token counts. The system was doing what it was built to measure, and the thing that broke wasn't on the list of things it measured.
This gap sits in the structure of the system itself. It's structural. Infrastructure monitoring tells you whether a call finished, but not whether the decision made inside that call was right. A request can finish with every span clean, no errors thrown, and latency under 500 milliseconds, while still carrying a faithfulness failure, a hallucinated detail, or a reasoning chain quietly drifting off course in a way that erodes output quality across thousands of interactions without ever tripping a threshold. Traditional observability catches errors. It has no mechanism for catching an answer that is simply wrong.
Sherlocks AI reviewed 73 production agent incidents between January and May 2026 and found tool-call failures to be the single most common failure type; the failures also tend to stack across multiple layers of the system rather than show up at one clean point of origin. A single tool-call anomaly can precede a downstream reasoning failure by several steps, so if you wait for the failure to become visible, you've already missed the moment a monitoring system needed to flag it. The gap between what an agent is actually doing and what the team believes it's doing tends to widen right after a deliberate change goes in. A prompt update meant only to soften the agent's tone, for instance, can shift its escalation behavior at the same time, and nothing in a standard error-rate dashboard distinguishes an intentional tone change from an unintended behavioral shift riding along with it.
The three harness-layer failure categories that latency spikes activate
Latency spikes don't produce one uniform kind of failure. They activate at least three distinct failure categories inside the harness, and each one has its own signature and its own point of intervention.
Tool schema drift
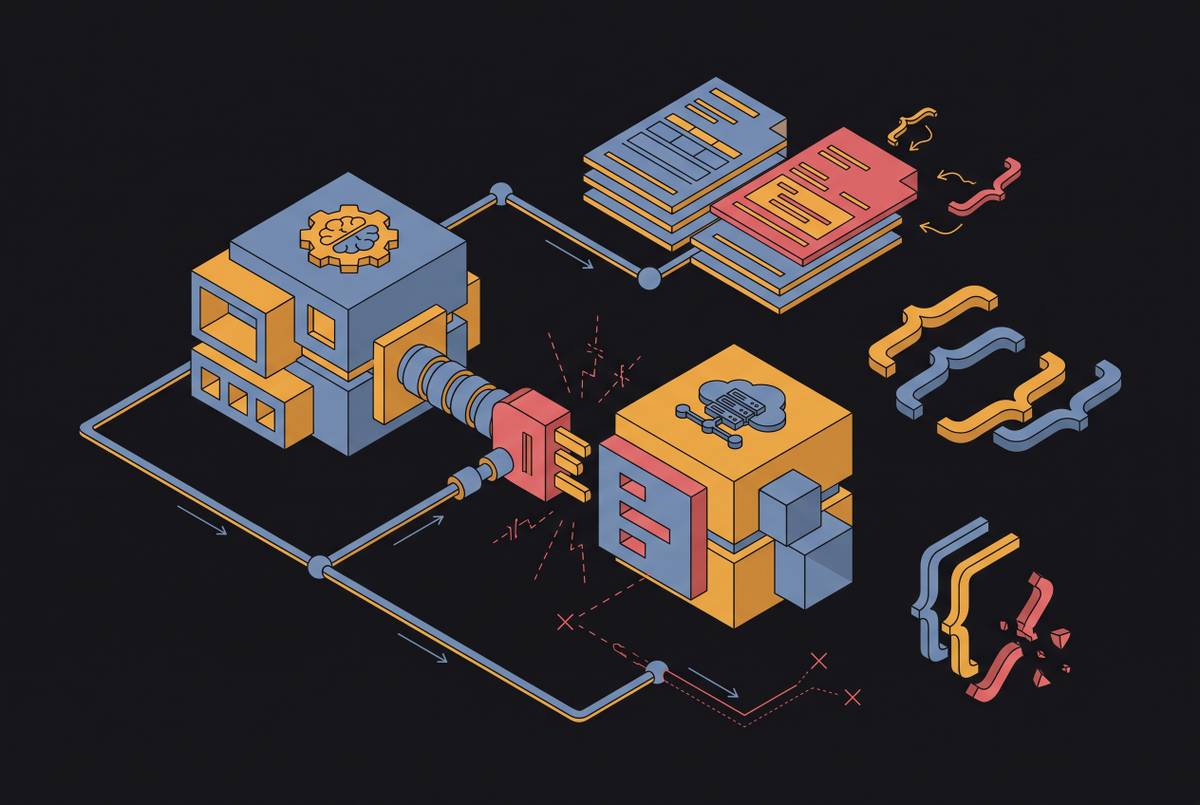
On servers under active development, schema changes can land within days of each other, and latency spikes often arrive alongside those updates rather than on their own, so a spike works as a leading indicator of drift, not a separate event to track by itself. A related and subtler version of this failure is memory-induced tool drift, where an agent's stored personal memories quietly bias which parameters it selects for a professional tool call. The MEMDRIFT benchmark covers five bias dimensions across seven professional domains, and it found that all seven frontier models tested showed substantial drift of this kind. A scan of 6,062 tools across 288 MCP servers flagged 608 of them as carrying parameters susceptible to this bias. In February 2026, n8n's Vector Store Question Answer Tool began generating invalid JSON schemas for function calling after users upgraded from version 2.4.7 to 2.6.3, halting enterprise production workflows, which shows how fast this can escalate. The only fix was a rollback to the earlier version. A tool-call pattern monitor watching for schema anomalies would have flagged the problem on the very first affected span, long before it reached production workflows at scale.
Prompt ambiguity and goal drift
Goal drift sets in when the agent pursues a goal adjacent to its actual task rather than the task itself, usually triggered by an ambiguous instruction or by a tool result that pulls its attention sideways. A slow tool response that comes back partial or malformed is a reliable trigger for exactly this kind of drift. Rising average token counts remain the measurable warning sign here too, flagging the prompt bloat and unnecessary context that widen the room for ambiguity across a multi-step reasoning chain. This category is especially dangerous because single-step evaluation misses it completely: an agent can reason correctly at step one, pull the wrong context at step two, and then act with full confidence on that wrong context at step three, producing an output that reads perfectly reasonable when judged in isolation from the steps that led to it.
Workflow loops
The clearest signature of a loop is tool-call repetition: the same tool called with identical arguments for a third consecutive iteration tells you the agent is stuck rather than making progress. A well-built harness keeps a rolling window of recent tool calls, watches for that repetition, and exits with a diagnostic message instead of burning the rest of its iteration budget on a run that has already stalled. Context overflow makes this worse over time, since long sessions fill the window and reasoning quality degrades progressively across the run, so the longer a loop continues, the less likely the agent is to find its way out of it.
Routing between equivalent tool providers as a quality decision
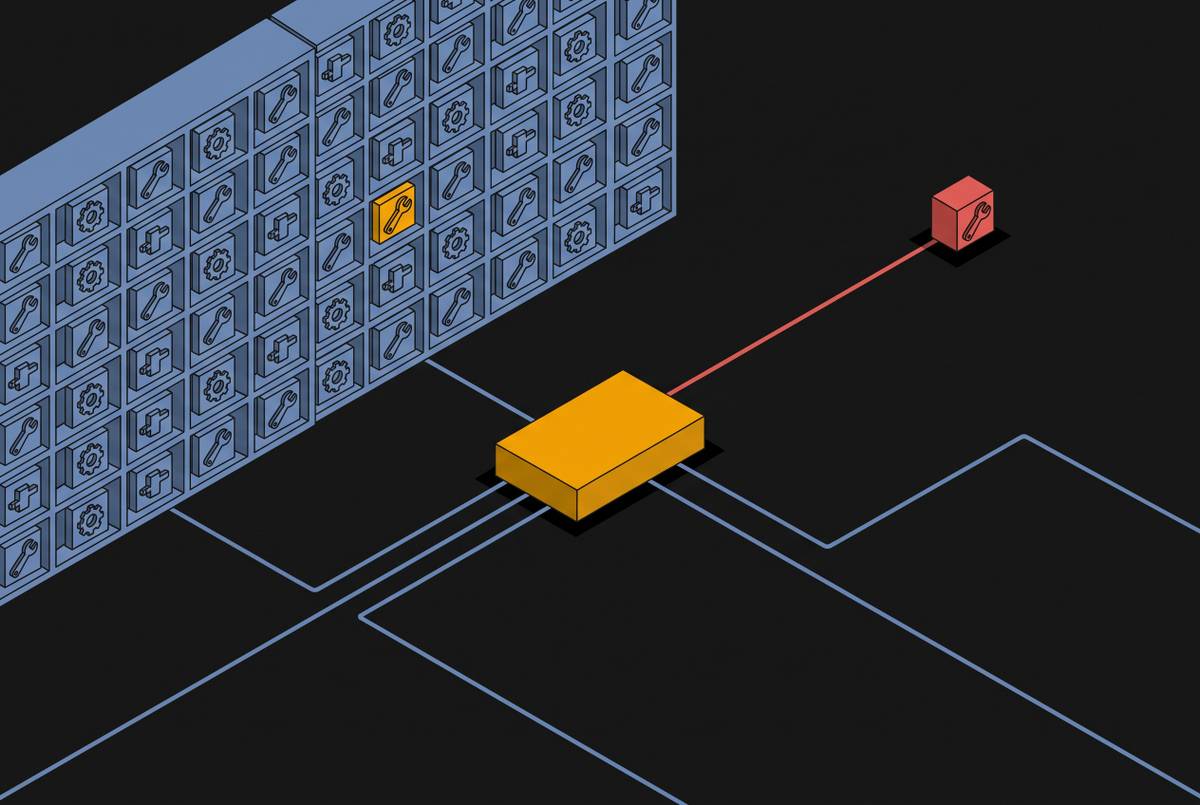
Tool-augmented agents increasingly reach the same kind of tool, a web search API, a retriever, an LLM backend, through several providers that expose an identical interface. Those providers are not operationally equivalent. Latency, reliability, and answer quality all shift across providers and load conditions, even when the function signature never changes. The decision about which provider handles a given call under load is, in practice, a decision about the quality of the context the agent will reason from next.
A router built only around priority lists and fallbacks, the kind common in production today, has no way to see this. It can satisfy a latency SLA by sending traffic to the fastest provider available and still quietly degrade the task the agent is trying to complete, because an additive latency-quality reward structure treats speed and correctness as interchangeable currency when they aren't. Research on this problem, evaluated across search, question-answering, retriever, and LLM-backend provider pools, offers a concrete counterexample in LQM-ContextRoute, a routing approach that reaches 0.583 F1 at 431 milliseconds in the search API pool while staying on the latency-quality frontier rather than trading one for the other. Those gains mean a harness reasons from good context instead of from whatever context happened to be fastest to fetch.
So provider routing is a harness design decision, handed off to a platform team only as an infrastructure configuration choice at its own risk. The provider selected under load determines the quality of the material the agent has to reason with on the very next step, so routing policy deserves the same scrutiny as prompt design or tool schema design, not a separate and lower tier of attention.
What production traces reveal that dashboards and logs cannot
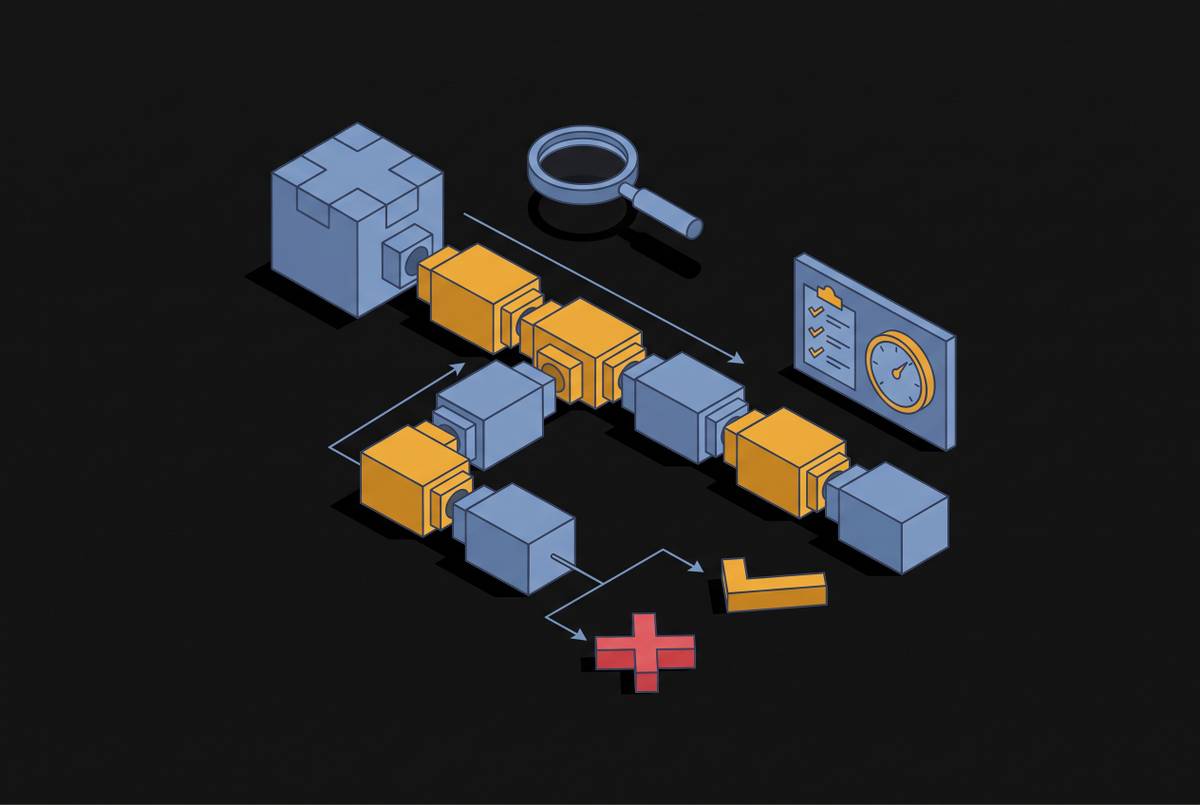
Agents fail differently than single-call LLMs do, and the signal that explains why lives in the full execution trace, not in an error rate, a latency average, or a flat request-level log. Monitoring tells a team that something is failing. Observability lets a team find the prompt, the retrieved context, or the specific broken tool call inside the chain, so they can see why. Most agent failures happen between calls, inside tool invocations, retries, and handoffs between agents, and a flat log renders all of that sequence as an undifferentiated list that hides the order in which things actually went wrong.
Three kinds of trace artifact matter most for catching this class of failure. A waterfall view that lays out every step in the exact order it executed, with durations stacked against time, shows a team what ran when, what blocked what, and where latency built up across a long agent run, a picture no flat log can offer. If you pair a sequence diagram or topology view, one that shows handoffs between agents and unusual tool-call patterns at a glance, with token cost and latency recorded per span, you can spot loop signatures and schema drift without parsing logs line by line. A baseline of tool-call distribution, recording which tools an agent calls, in what order, and at what frequency during a known-stable period, gives a team something to measure deviation against. If call frequency shifts meaningfully on a high-volume agent, you should look into it before users ever notice anything wrong.
None of this replaces evaluation. Modern observability pairs the trace with a quality score: the trace shows what happened, and the evaluation judges whether it was good. A request can complete cleanly and still carry a faithfulness failure or a reasoning chain that drifted off course, and no structural alarm will trip. If you record output quality scores per span and track them over time, you can catch a quality distribution shifting downward in production long before it appears as a spike in complaints. Trajectory coherence checks ask whether a context-retrieval step actually pulled content relevant to the task it was then used for, and they catch propagation failures that scoring only the final output would miss.
Root cause attribution: tracing a failure to the layer that owns it
If a run failed, that alone tells a team almost nothing about where to intervene. An outcome-level signal, a wrong answer, a dropped accuracy number, a user complaint, offers minimal insight on its own, because the same bad outcome can originate in the prompt, the tool layer, the workflow logic, the memory system, or the underlying model, and each of those requires a different fix. Root cause attribution is the work of tracing a given failure back to the specific layer that owns it, using the trace artifacts and the quality scores together rather than either one alone.
That attribution is harder than it looks precisely because the failure categories described above don't announce themselves. A tool schema drifting out of compatibility with the model's function-calling format looks, at the surface, like the same kind of stall as a workflow loop or a goal that quietly shifted underneath the task. You have to read the waterfall against the sequence diagram against the token-cost trend against the quality score, and trace the first point where the chain bent away from the task, not the last point where it became visible. The n8n schema failure from February 2026 illustrates the value of getting this right: a tool-call pattern monitor would have flagged the invalid schema on the very first affected span, long before it froze production workflows across an entire enterprise deployment. Done well, attribution stops teams from patching whichever layer is easiest to see and directs the fix to the one that actually caused the failure.
Sources
- Latency-Quality Routing for Functionally Equivalent Tools in LLM Agents
- Callability Is Not Operability: Controlled Interface Interventions for LLM Agents
- Evaluating Agentic AI in the Wild: Failure Modes, Drift Patterns, and a Production Evaluation Framework
- Harness-Bench: Measuring Harness Effects across Models in Realistic Agent Workflows
- AgentDebugX: An Open-Source Toolkit for Failure Observability, Attribution, and Recovery in LLM Agents
- TRAJDEBUG: Tracing Error Lifecycle to Identify Critical Failures in Long-Horizon Agent Trajectories
- Root-Cause Attribution Is a Search Problem: Continual Search for Long-Horizon Agent Failures
- When Agents Fail: A Comprehensive Study of Bugs in LLM Agents with Automated Labeling