Tracing Corrupted State Across LangGraph Nodes When No Exception Is Ever Raised
Find silent state corruption in LangGraph by comparing intended and accepted updates.
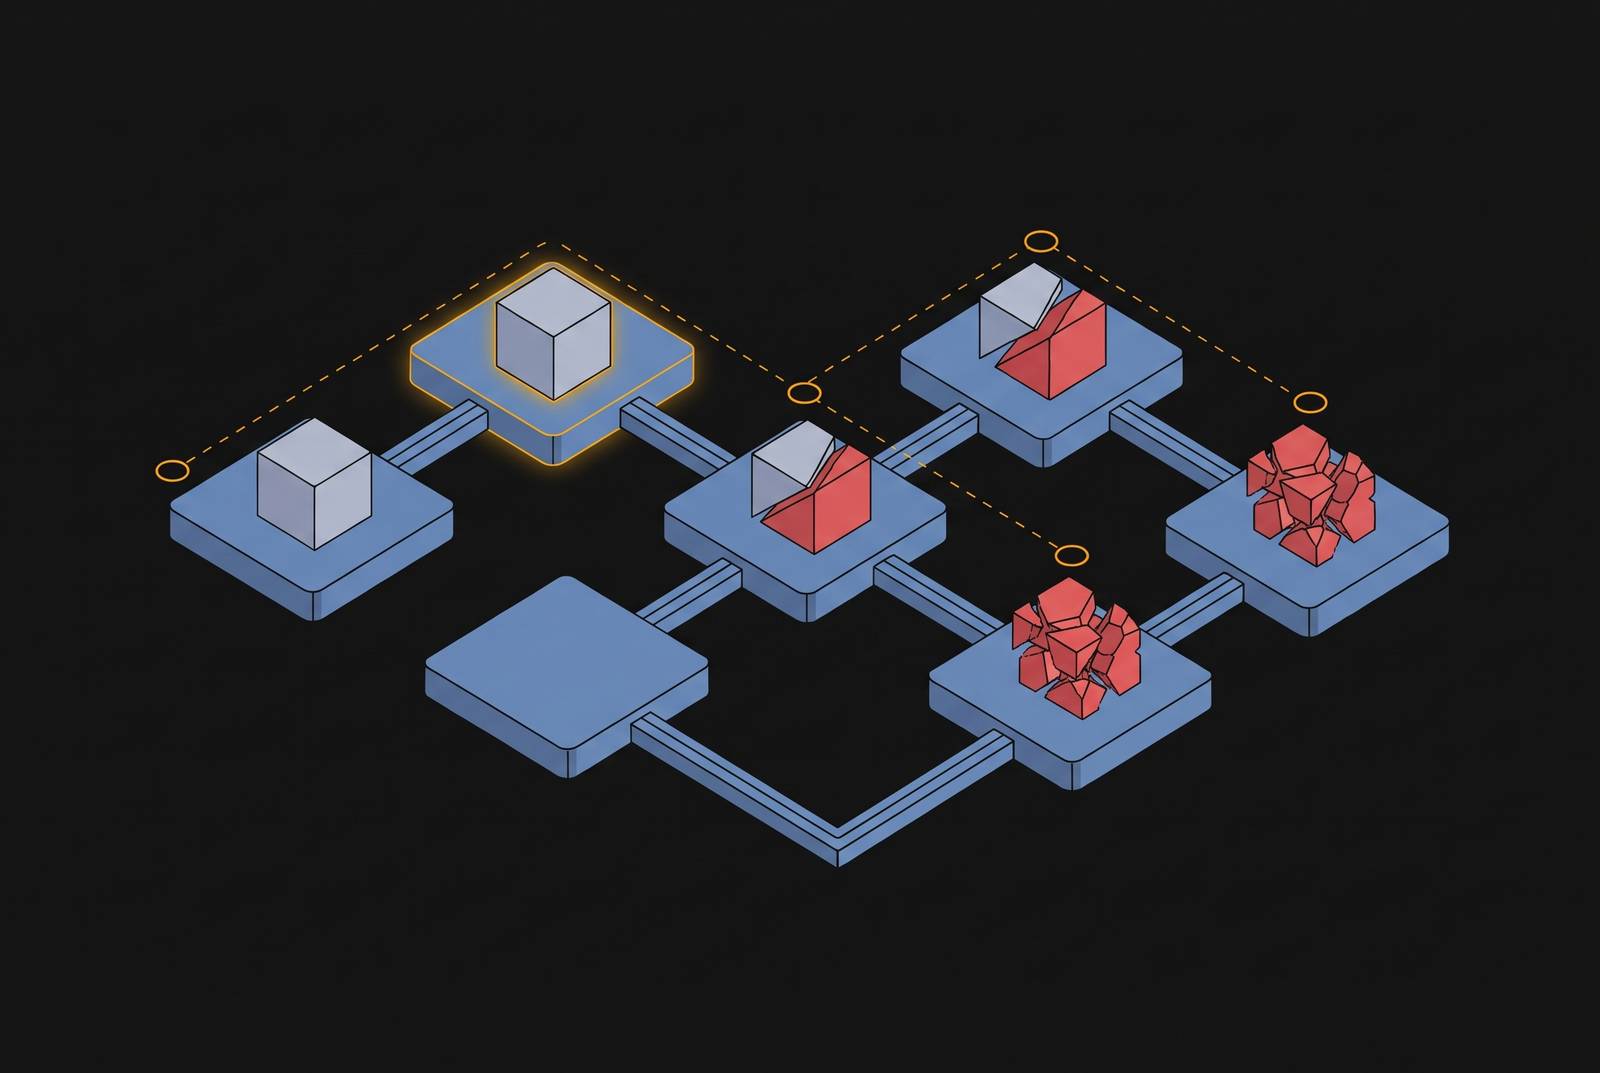
To detect silent tool failures in production multi-agent pipelines, tracing must cover state transitions as well as successful calls. In LangGraph, a node can finish without an exception while its update is dropped, overwritten, or left stale. To debug wrong answers, compare intended updates with accepted state, locate the first broken transition, and validate the fix against the production trace that exposed it.
How LangGraph's state-merge layer works and why it is the source of silent corruption
LangGraph state is a set of channels. Each state key has its own update semantics. It works like a pancake kitchen where each station posts updates to named mailboxes. Posting an update does not establish what the next station will receive. The channel’s merge rule determines that.
The merge happens after the node function returns, so the node never observes what that merge accepted or discarded. A field annotated with a reducer such as operator.add combines updates at merge time, while an unannotated field uses overwrite semantics for successive writes. Concurrent writes introduce a separate constraint, discussed below. The superstep follows a plan, execute, and update sequence, and an exception discards the step’s writes. Silent corruption instead occurs when execution completes but the accepted state no longer represents the intended update.
Key mismatch between a node's return dict and the declared schema
A return key that does not match the declared schema can disappear at the merge boundary. The node itself still reports successful execution. For example, a node returns search_query, while both the schema and the next node expect query. The undeclared key does not appear in the applied update, and the expected channel receives nothing.
If query is absent, the downstream read can raise a KeyError. If it already contains a value, the next node reads stale data instead. That second outcome is harder to recognize because the value can still look reasonable. Several nodes may operate on it before the final answer exposes the error. Without per-node state diffs, the visible failure points away from the node that introduced it.
The defensive response is to make the return contract explicit. Every node code path should return a plain dict with the expected keys, rather than a bare string, list, or Pydantic model instance. A pre-commit smoke test should invoke the graph with minimal input and assert that expected state keys are present. Reducer annotations govern how values merge, while return-contract checks address channel names.
Reducer collision when parallel branches write to the same channel
A graph that works on a single path can become incorrect when a parallel branch writes to an existing channel. The original tests may remain entirely green. The latent risk appears only when a fan-out, subagent, or retry path introduces a second writer. If that path runs intermittently, production receives wrong answers without a consistent exception to investigate.
When the runtime detects concurrent writes without a reducer in the same superstep, it raises InvalidUpdateError. That is the useful outcome because the conflict becomes explicit. The silent path occurs when overwrite semantics replace a value without triggering that concurrent-write check, leaving execution free to continue.
The remedy belongs on the contested channel. A list field can use operator.add, while other fields may require a custom accumulator. The reducer must combine values as intended, which takes more than stopping a conflict. Before a fan-out refactor ships, every shared channel should be audited for reducer coverage. Otherwise, a topology change can invalidate assumptions that were safe only with one writer.
Subgraph schema boundary mismatch as a slow-burn stale-state source
A subgraph handoff extends the same contract problem across two compilation units. Its output schema and the parent’s input schema may live in different files or belong to different teams. A mismatch can leave parent state unchanged without raising an error. The subgraph runs, but its intended contribution never reaches the parent’s subsequent nodes.
The trace can make this failure look contradictory. Subgraph latency is present, and internal execution appears complete, yet the parent’s next node receives values from before the call. Inspecting only the subgraph cannot resolve that contradiction. The decisive evidence is the parent state snapshot immediately after the subgraph returns, where the expected update is absent.
The undefined-return node and the tool-empty-response hallucination trap
If a node return is undefined or empty, every channel can stay unchanged. The router then evaluates the previous step’s values. Depending on those values, execution can loop or exit prematurely without an exception. There was no useful update to merge.
A failed tool call can create a subtler version of that gap. An API returns an empty array or blank JSON, and the tool node passes it forward without checking its meaning. The LLM then generates a filler answer from inadequate input. The run still looks healthy on a success-rate dashboard. The tool ran, the model responded, and no exception interrupted the path.
The corrective action is validation inside the tool node, before its response enters state. When an empty response means failure, the node should return a typed error flag such as ToolX_EmptyResponse through the declared error channel. A conditional edge can then route to a fallback. Unlike a standard Python exception, that error state preserves graph continuity while giving the router an explicit decision input. By the time output evaluation runs, it is too late to protect this transition.
How can you tell if a tool call failed silently inside a multi-agent workflow?
Traditional APM observes execution. A successful call and a completed response can both be true while the data between them is wrong. This is a structural detection gap. Per-call LLM logging has the same limitation when a wrong answer at step 10 originates in a corrupted write at step 3.
Production tracing must capture the full input state and the output state accepted at each node. The diff exposes dropped keys, overwritten values, and stale fields that later nodes depend on. On LLM nodes, the trace also needs token count, latency, tool arguments, and raw responses. On tool nodes, it needs both the raw API response before transformation and the value passed forward. This shows whether the upstream response was empty or the transformation damaged it.
Edges need evidence of their own, including which branch actually fired and a running count when an edge fires repeatedly. Those counts help distinguish a converging loop from a stuck one. Checkpoints preserve state for later inspection and replay, while tracing records node, edge, and retry activity during execution. Neither substitutes for the other’s role. Across agent boundaries, a shared trace ID preserves the causal chain so corrupted context from agent A is not misattributed to agent B.
Using graph.stream(), checkpointer snapshots, and trace replay to locate the exact corrupted node
The first diagnostic step is live streaming. graph.stream() with stream_mode='updates' exposes node update events that can be compared with the node’s intended return. A missing expected key directs attention to the return contract or merge boundary. With stream_mode='values', the full accumulated state after each step makes it easier to see which values are missing or stale. This is especially useful immediately after a subgraph handoff.
After a failure, checkpointer inspection answers a different question. A graph compiled with a checkpointer such as InMemorySaver, and assigned a thread_id, can expose its saved state through get_state(config). That snapshot shows which node is next and the state it will receive, without re-executing the agent. Test isolation remains important during this inspection. Reusing a thread_id across runs can preserve stale state and make a clean run appear corrupted, or obscure the original defect.
Replay comes next when a failure is triggered by the sequence of steps in production. Streaming shows what is happening now, while a snapshot shows what was saved. Replay tests a proposed change under the same conditions that brought the problem to light. These techniques answer different questions in sequence. Treating them as interchangeable loses the distinction between locating a bad transition and proving that a correction survives it.
State bloat and checkpoint latency as a secondary production failure that the same tracing discipline catches
The same state diff also exposes excessive accumulation. If a node’s output state is orders of magnitude larger than its input, a channel may be accumulating values where replacement was intended. As that payload grows through a session, checkpoint cost compounds. Latency increases without information going missing, and the evidence comes from the same transition record.
No separate debugging practice is required to notice it. The comparison shifts from key presence and value meaning to payload size. This makes node-level tracing useful beyond correctness failures without changing its central purpose.
Building a harness that catches silent corruption in CI before it reaches production
Production traces become more valuable when they become regression cases. A harness built only from synthetic benchmarks may never reproduce the state sequence that exposed a real failure. The preventive step is to run those production-derived cases in CI and evaluate both intermediate transitions and final answers.
For each node, LLM-judge rubrics should score how well it updated shared state. Relevant criteria include required-field retention, field types, reducer behavior, and channel invariants. Replacing a value where the contract calls for appending should fail that evaluation even if the answer is still acceptable. Strict tool-output validation, such as Pydantic validation, should run inside the tool’s execution block before the value goes into state. An upstream API schema change can then fail CI, preventing contamination of downstream state.
The eval set must also change over time. Prompt tuning can make fixed cases easy to pass while new failure patterns go untested. Rotating a portion each quarter with real production failures helps prevent that decay. A nightly job should additionally sample recent production traces for changes in tool-call distribution, structured-output schema conformance, and long-horizon context relevance. These checks show when the planner shifts, validation failures rise, or prompts grow but lose touch with the original goal.
From observed corruption to verified fix: the complete workflow
The workflow starts with a production trace containing a wrong answer and no exception. That is a reason to inspect state, with the cause still to be verified. Streaming diffs, saved snapshots, and replay then narrow the investigation to the first incorrect transition. The target is the exact node and key that were dropped, overwritten, or left stale. Later symptoms show how the corruption propagated, while its origin may lie earlier.
Attribution determines the appropriate correction. A key-name mismatch calls for a fix to the schema, while a reducer collision calls for a change to how the graph merges writes to shared channels. A subgraph mismatch calls for a fix to the boundary contract, and an empty tool response calls for validation before the state update. The historical failure trace then becomes the validation case. A change is ready to ship when replay passes the failure cases without regressing the passing cases.
The final step is to preserve that evidence. Adding the exposing trace to the eval set turns a production incident into a repeatable regression check. Future refactors can then be tested against the same transition that once failed silently.